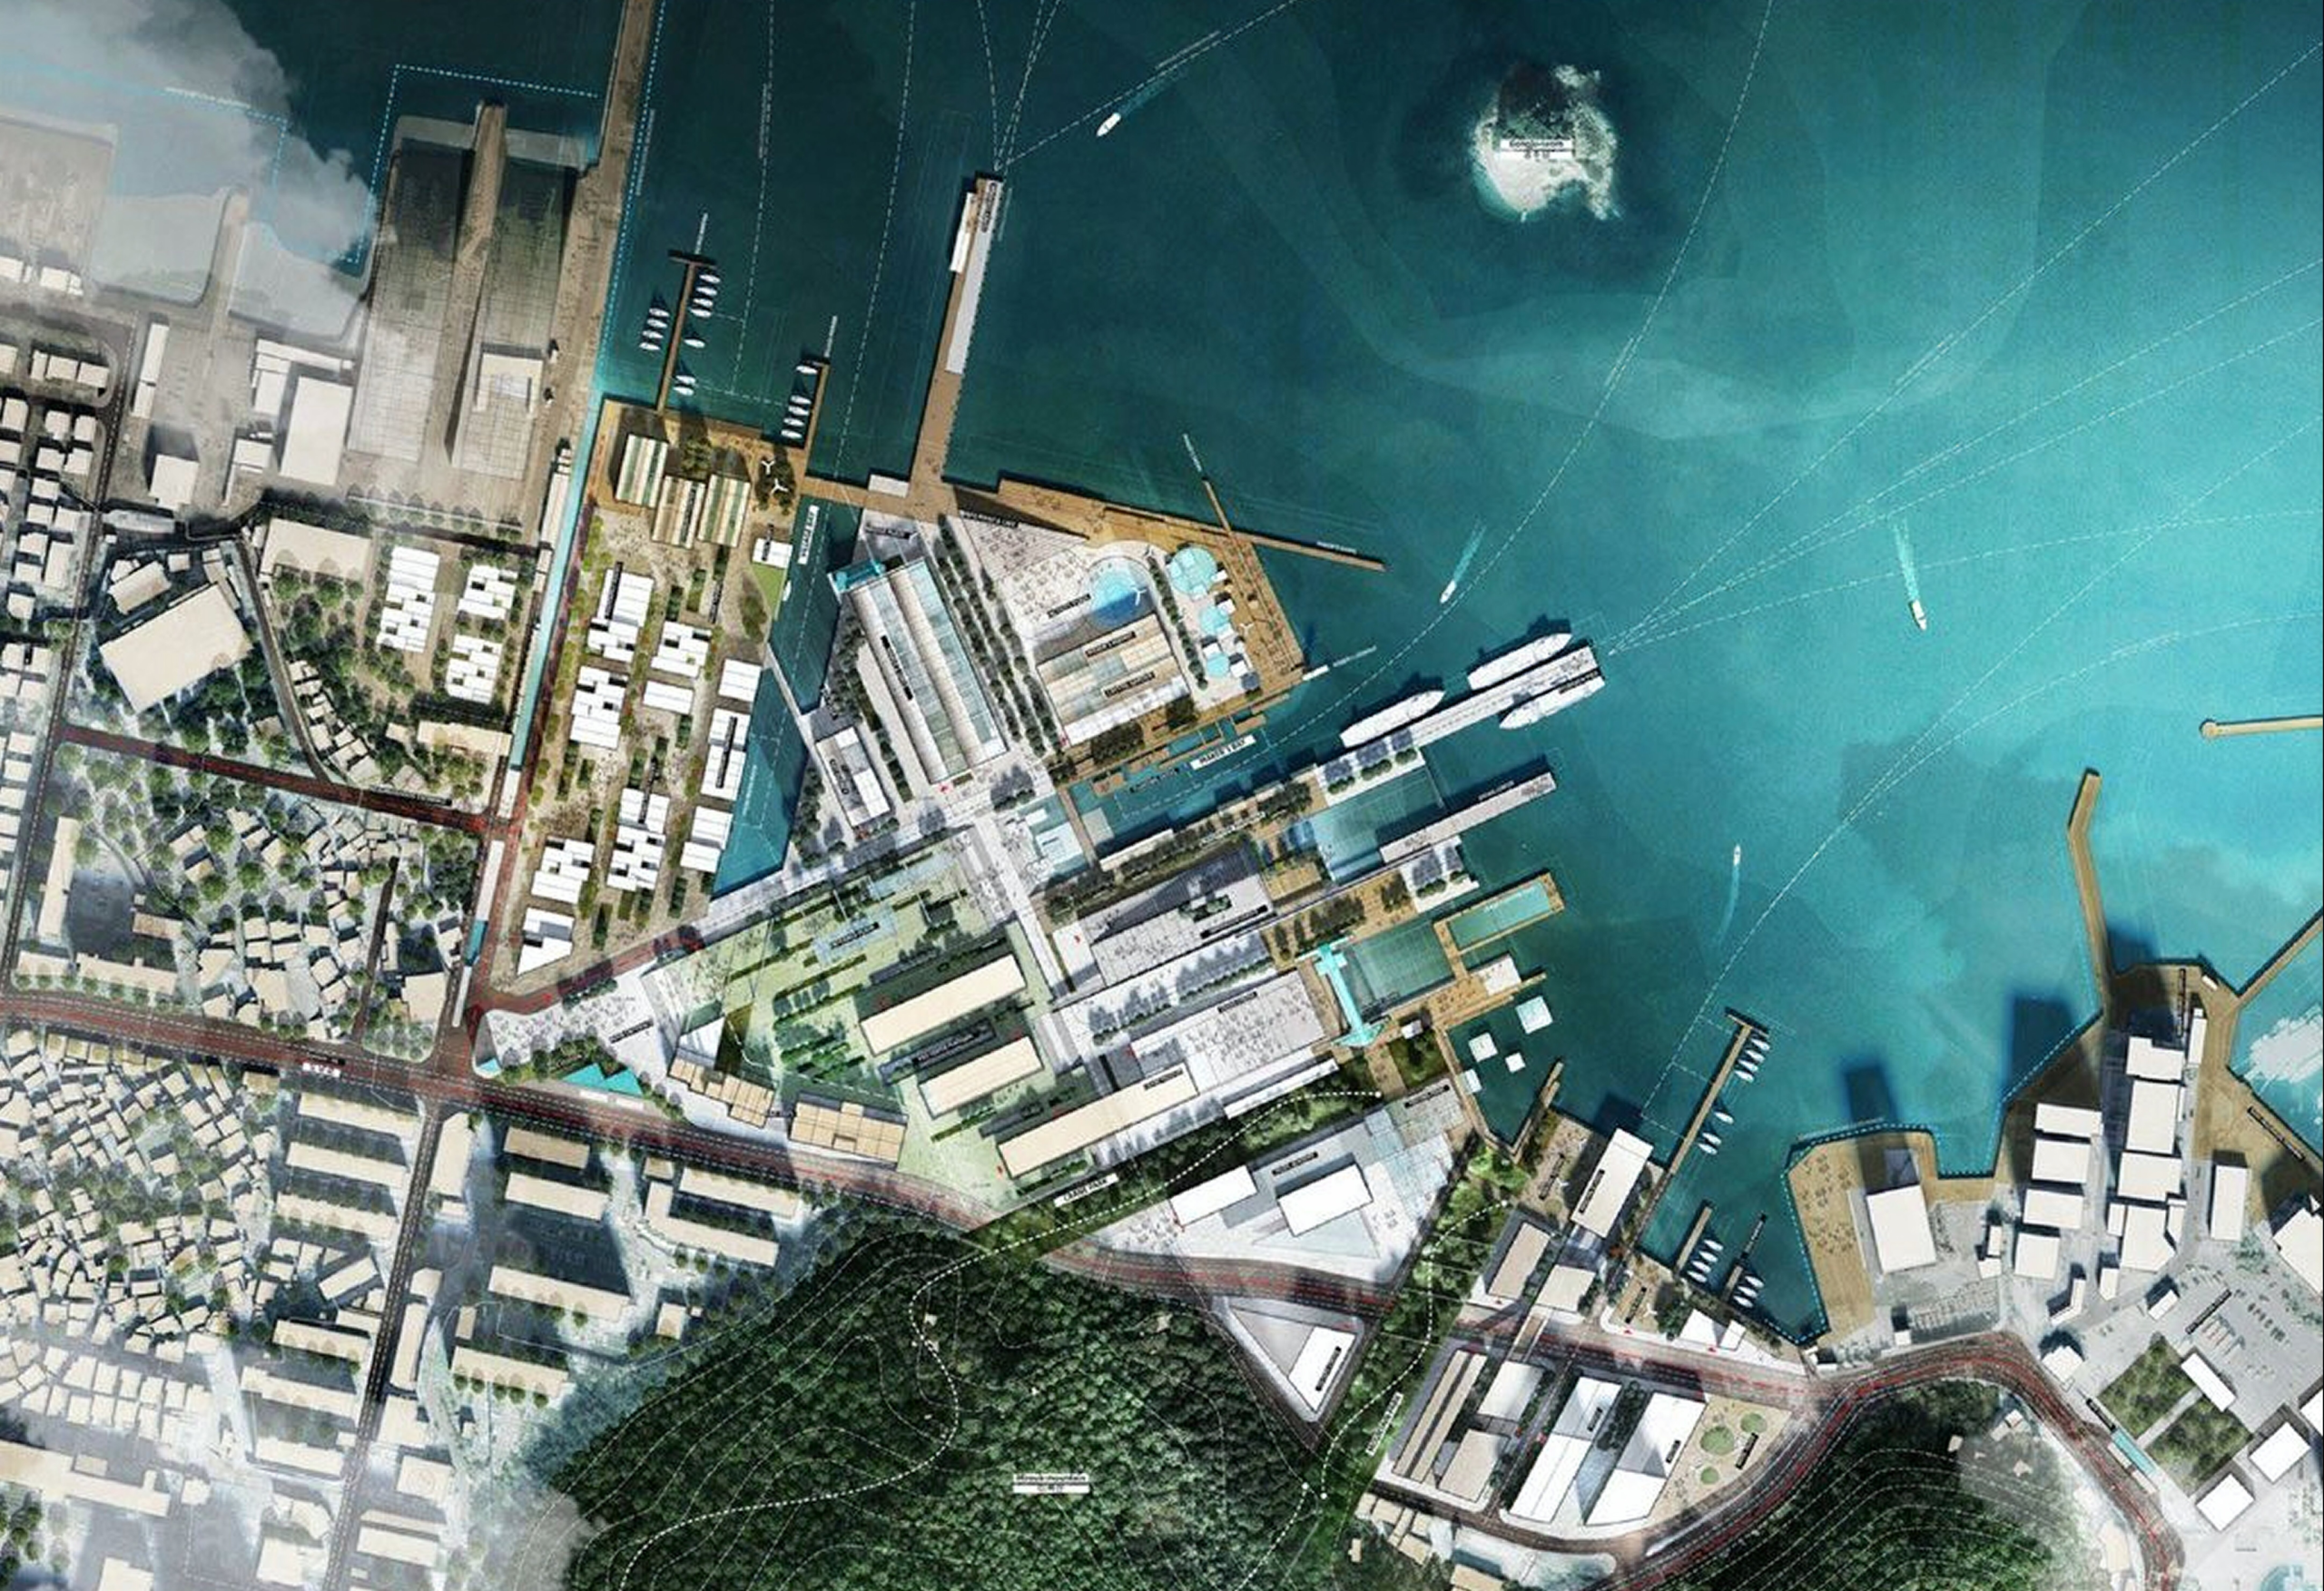
Digital Twin for urban heat
Urban heat islands, heat stress, exposed populations: a heat wave does not affect an area uniformly, and temperatures can vary from one street to the next. Local governments must now factor urban overheating into their climate adaptation policies, as required by French local, regional and national climate plans, and justify their choices.
The digital twin for urban heat maps surface and air temperatures across your area and cross-references thermal indicators with population and urban vulnerability data. It then simulates your greening, de-sealing and urban design scenarios to assess their benefits before you invest.
STAKEHOLDERS
A shared view for climate, planning and public health teams
Tackling urban heat involves many departments: urban planning, public health, social services, green space management and technical services, as well as elected officials. The digital twin for urban heat brings them together around a shared view, so they can coordinate actions suited to each local context.

Local governments and inter-municipal authorities
Factoring overheating into your adaptation policies means backing every priority with evidence. The digital twin provides the indicators and warming projections to support your decisions, from neighborhood to regional scale.

Technical and urban planning departments
Greening, de-sealing, cool islands: you manage costly projects in constrained public spaces. Localized thermal indicators help you prioritize the most affected areas.

Developers, property owners and social housing providers
Your projects affect the local microclimate. Before-and-after indicators let you quantify their real impact and back up your commitments to the community.

Public health and social services
Heat affects some population groups and facilities more than others. By combining heat stress, at-risk populations and social vulnerability, you can target prevention measures where they matter most.
context
Map, anticipate and manage urban heat across your area

Bring your policies into compliance
Local governments must now address urban heat islands in their local climate plans and regional planning schemes, in line with the national adaptation plan and the national warming trajectory. This complex task affects infrastructure resilience, how human activities adapt and the preservation of natural heritage.

Understand how your area reacts to heat
How does your area actually behave during a heat wave? Without fine-grained mapping, it is hard to pinpoint the neighborhoods, facilities and populations most exposed to heat.

Build a consistent heat strategy
A consistent thermal comfort strategy requires analyzing a wide range of indicators: urban morphology, heat island intensity, heat stress, green spaces and water management. This essential groundwork is often hard to turn into a concrete action plan.

Measure the impact of your projects
How do you objectively measure a development project’s impact on the local microclimate? You need to model the project, compare before-and-after indicators and share a clear, compelling analysis with stakeholders.
OUR PROMISE
Map, anticipate and manage urban heat across your area
Pinpoint urban heat islands street by street, identify vulnerable neighborhoods and populations, and test your cooling scenarios in a digital twin that accurately reflects your area.
FEATURES
What the digital twin for urban heat lets you do
Map urban heat island effects
Model day-night temperature variations, heat stress and temperature anomalies relative to a rural reference, at every scale from parcel to block, neighborhood, city and metropolitan area.
 2D/3D model of your area
- Urban heat island intensity and heat stress indicators

Identify overlapping vulnerabilities
Cross-reference thermal indicators with urban activity, traffic flows, sensitive infrastructure and vulnerable populations to identify your priority areas for action.
- Mapping of overlapping thermal, social and infrastructure vulnerabilities
- Thermal and urban morphology analysis of your area
Manage your heat strategy from a single platform
Access all your analyses and simulations in one place. Compare scenarios, then view and share your data with your teams and partners.
- Indicator reporting and tracking via customizable dashboards
Simulate your design scenarios and assess their impacts
Test different urban planning scenarios and evaluate the expected benefits—before making any investment decisions.
- Analysis of the Impacts of Development Projects on Urban Temperatures
indicators
Key indicators calculated by the digital twin

Environmental indicators
Surface and air temperature, day and night
Heat stress (UTCI)
Sunshine duration and solar radiation
Impervious surfaces and soil permeability
Naturalness index and tree canopy cover
Albedo and sky view factor

Urban and social indicators
Urban morphology (morphological units) or Local climate zones (LCZ)
Land use and land cover
Public space use
At-risk populations
Social vulnerability
In short
A digital twin to act where heat hits hardest
Each indicator is linked to a 3D view of the area, from the neighborhood to the region. You can show where overheating is concentrated, who it affects, and how a development project actually changes the local microclimate. This information can inform a Climate Action Plan (PCAET), support the direction of a Local Urban Development Plan (PLU) or an Integrated Local Urban Development Plan (PLUi), and integrate thermal comfort into a measurable path toward climate resilience.

They trust us