Digital Twin for flood risk
When a flood hits, how do you know who and what is at risk? The digital twin for flood risk models flood propagation for each water level, identifies at-risk buildings and vulnerable populations, and links forecasts from France’s national flood forecasting service (Vigicrues) to a 3D model shared across crisis teams. From regulatory assessment to operational management, get reliable data to anticipate, decide and build resilient planning strategies for extreme events.
stakeholders
A common framework for flood risk management
Prevention, early warning, crisis management, post-flood analysis and recovery: at every stage of the risk cycle, stakeholders need to make fast, sound decisions. The digital twin gives everyone a shared model of the area to learn from past floods, anticipate future ones and test the most extreme scenarios.

Urban planning, technical and risk management departments
Flooding remains the leading natural hazard in France, and soil sealing increases runoff. Cross-reference hazards with exposed assets to balance protection, restoration and urban development, and test your scenarios before any work begins on the ground.

Prefectures (State Authorities), fire and rescue services (SDIS), crisis teams
Floods can strike suddenly, so preparation is key: identify which bridge closures would isolate neighborhoods, which roads would become impassable and which areas to evacuate first, even in extreme scenarios such as a levee breach during a 100-year flood.

Engineering firms, infrastructure and network operators
Build on a reliable 3D foundation (high-density LiDAR, national land cover data, local urban plans, satellite imagery) to refine your hydrodynamic simulations and safely site your critical equipment.

Residents, community groups, neighborhood councils
3D visualization makes risk easy to grasp, even without hydraulic expertise: in just a few minutes, anyone can see why some streets become dangerous during a flood. It helps build a risk culture and teaches people the right responses.
Context
Flood risk is putting your area to the test
Meet regulatory requirements
The EU Floods Directive requires a preliminary flood risk assessment, flood hazard and risk maps, and flood risk management plans. Drawing up or revising a flood risk prevention plan (PPRI) or flood prevention action program (PAPI) calls for objective geospatial data.
Forecasting and operational management
Moving from reactive to proactive management means pinpointing at-risk buildings, areas likely to flood and vulnerable populations before the situation becomes critical. This is a real coordination challenge for elected officials, technical departments and field teams.
Resilient planning strategy
As extreme weather events become more severe, analyzing the impact of past floods and prioritizing preventive planning scenarios has become essential. Building a truly resilient strategy for your area requires objective historical data.
our promise
Prepare for floods. Protect your community.
The digital twin for flood risk maps, forecasts and quantifies flood risk, from street level to the entire watershed.
FEATURES
What the digital twin for flood risk lets you do
Map flood-prone areas
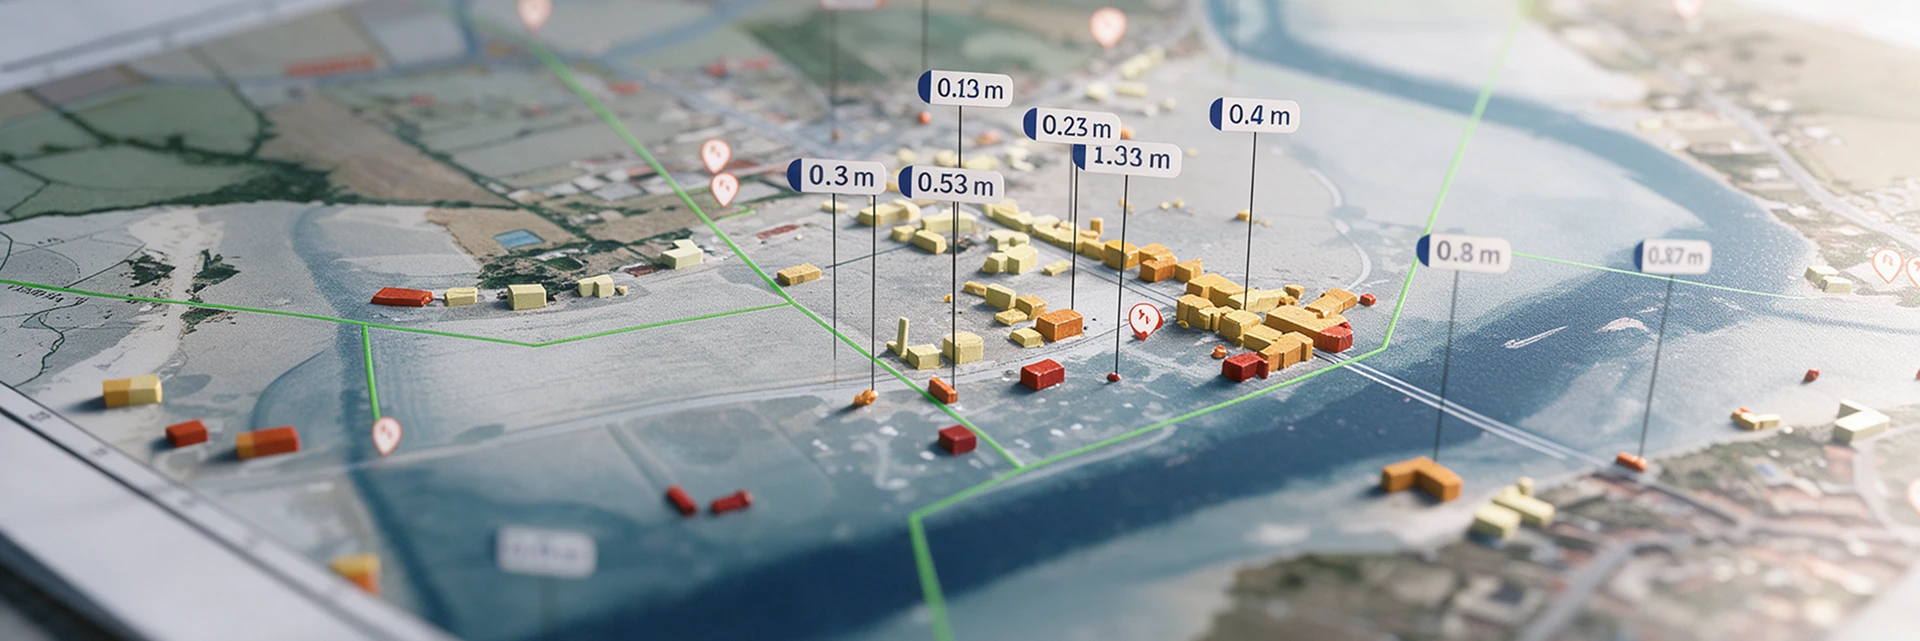
Model flood propagation for each water level, based on hydrological and topographic data and models for your area.
 2D/3D model of the selected area
- ✓ Flood propagation simulation based on flood zones by water depth class (ZICH)
- ✓ Dynamic mapping of flooded areas, building by building and street by street, with water depth calculation

Simulate floods and identify overlapping vulnerabilities
Cross-reference flood exposure with the locations of sensitive facilities, vulnerable populations and critical infrastructure to prioritize your response.
- Identification of sensitive infrastructure and vulnerable populations at risk for each flood scenario
Anticipate and coordinate your crisis response
Anticipating and Coordinating the Crisis
Link national flood forecasts (Vigicrues) to the 3D model of your area to visualize the impact of rising water levels and coordinate a collective response.
- Access to Vigicrues forecasts (up to 72 hours ahead) (à vérifier)
- Dashboards shared across crisis teams: elected officials, technical staff and field
Analyze past events
Measure the real impact of past floods on your area to objectively assess future risks and evaluate how the crisis was managed.
- Historical flood simulation
- Post-event review and model calibration
Indicators
Key indicators calculated by the digital twin

Hydrological and environmental indicators
Reference scenarios: frequent (10-year), medium (100-year), extreme and intermediate
Flood level and water depth
Impervious surfaces and soil permeability
Flood exposure index by zone
Modeled vs. observed flood extent

Socioeconomic and asset indicators
Sensitive buildings: schools, healthcare, cultural and hospitality facilities, buildings open to the public
Vulnerable populations in flood-prone areas
Roads and bridges affected by flooding
Exposed utility networks: gas, electricity, drinking water, sewerage, waste management
Priority evacuation zones
In short
A digital twin to act before the water rises
Every indicator is linked to a 3D view of your area. From flood levels to at-risk buildings, get an operational overview, sector by sector.

They trust us